All Posts By

Michael Trezza

Michael Trezza is the CEO and founder of Lithyem. Since 1999, Michael has been solving complex technology challenges for some of the world's greatest brands. Connect with Michael on LinkedIn.

Google is Watching You… Everywhere

By Systems Thinking

Most people assume that Google knows pretty much every move they make these days, but few really take a moment to consider the true extent of that knowledge. The first step in securing your digital footprint is knowing what that footprint is and who has access to it. Let’s start with Google – the mother of all big brothers. Start folding your tinfoil hats folks.

Timeline & Location

Ok so first up, Google Maps Timeline. Google stores your location history (if you have it turned on). You can see, down to the time of day, exactly where you’ve been and when you where there – as well as how long it took you to get there.

Search History

This is a fun one to explore… your Search History. Google stores your search history across all your devices in an interesting way. The only way to delete all your search history is to do it from EACH DEVICE you searched on. Good luck with that.

Ads

Google stores an advertisement profile about you – what you like, what you don’t like – based on your age, location, gender, hobbies, and pretty much every other data point they have on you.

Apps

Google knows every app and extension you’ve used, when and how often and who with. Assume they know when you go to sleep at night with all this info.

YouTube

Want to know EVERY video you’ve watched on YouTube? Based on that they know your interests, hobbies, religious affiliation, medical issues… on and on and on.

Photos

Every photo you take (if you have it turned on) it happily sitting on Google’s servers along with location, date and time. Oh and there’s facial recognition built in too so it know’s who’s in the pics. Not spooky at all.

Everything Else

What else? Well let’s see… Bookmarks, emails, contacts, Google Drive files, photos, books you’ve read, companies you’ve bought from, products you’ve purchased, etc and on and on.

So Now What

Well not much beyond going back to paper and pencils… but to start, have a look at ALL the data Google has on you. They offer a service called Takeout which lets you export and download a complete archive of your data from Google’s archive. From there you can make some decisions about what data you are OK with sharing and what data you are not. You can selectively enable and disable Google’s access to data if you’re concerned about privacy, which today we should all be. At the very least, you’re now informed which is a start.


I want to thank Dylan Curran for first outlining this information – follow his Twitter, it’s scary 🙂
Building Better Dashboards

By Systems Thinking

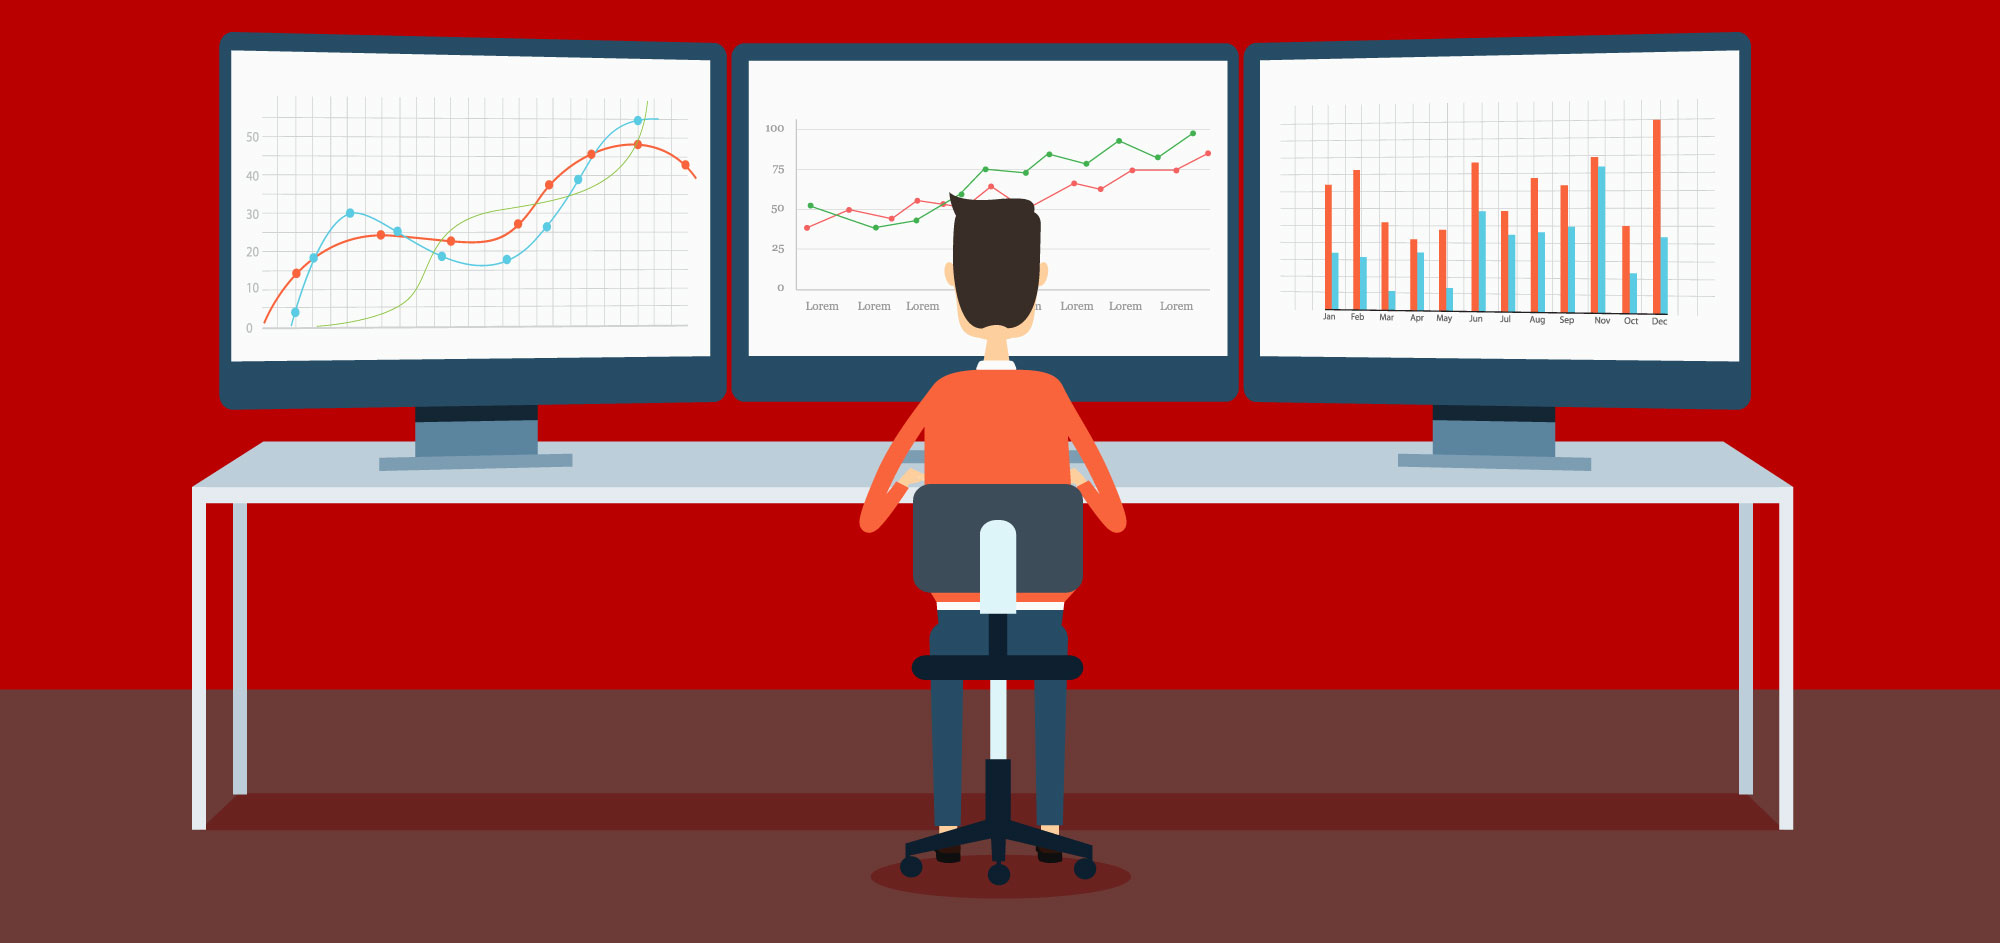
Building better software dashboards

No dashboard for your business? Every day I’m amazed at how many businesses are operating with out-of-date and manually aggregated (think hours of copy & paste in Excel) data that isn’t clearly presented in an easy to view format. With the abundance of tools, free and paid out there, there’s no excuse not to have your finger on the pulse of your business or department.

I want to outline here some of the key questions to consider when building out a business dashboard.

1. Who is the dashboard for?

Consider the audience of the dashboard first. Is it for the executive team where granular operational metrics would be confusing and high level leading and lagging indicators would be appropriate OR is it for an operations person that needs the real-time data and is less concerned with lagging indicators? Start with thinking about the intended user and what data they would need to improve their job function, and leave all other data for a different dashboard.

2. What numbers “move the needle”?

It’s easy to fall into the trap of adding every metric you can think of to a dashboard, and end up with an overloaded mess that defeats the purpose entirely. The more information displayed at once time, the less important each one becomes. Consider what the critical, important metrics are for the function or department that the dashboard is for. If you’ve defined the KPIs properly, than having 1 or more of them fall out of line would indicate that it’s time to dig deeper. Don’t add confusion and bloat by putting everything on screen at once.

3. What is the best way to visualize the data?

You can plot the same metrics in multiple ways. You can show historical data compared to current data, show trends, show progress towards a goal, etc. Let’s say for example you have a KPI for Number of Leads that you want on a dashboard. You can display it simply alongside a goal number, display it as a progress bar, or show the previous 12 months Number of Leads to indicate growth or lack of it. Think about what you want the metric to reveal or uncover when visualized on the dashboard.

4. Does it tell a story?

Is the dashboard easy to understand quickly and what story does it tell? Numbers are only relevant and actionable in context. Is the Number of Leads on your dashboard telling the story of growth over time or would it be more appropriate to tell the story that tis month we hit our lead generation goal. Adding a trend line, for example, would tell the story of where things might be headed. Same numbers, different story and all about context.

5. Where is the data going to come from and is it automated?

This is one of the more challenging bits for most companies, where Excel is king and data is mainly stuck in static systems. After you’ve identified the dashboard KPIs and considered how to best visualize them for maximum clarity and impact, it’s time to think about how you’re going to get at that data. Does is need to be manually entered from an Excel sheet or is it in an online platform that can be tapped into easily? Even a static data source like Excel can work fine with the right processes in place to ensure it’s always up to date, but the ideal solution is one that takes no effort to aggregate. Connecting your dashboard to your CRM to pull in the number of leads, for example, will always be real-time and accurate vs a manually aggregated solution.


If you want more information on designing, developing and implementing business dashboards, contact us for a free consultation.

Duck, it’s a missile… wait no, kidding kidding. And how a terrible software interface was at fault.

By Systems Thinking

Hawaii Missile Alert Bad Software Was at Fault

​An emergency notification on Saturday informing Hawaiians that a missile was inbound and moments from impact in their vicinity left residents, visitors, and vacationers of the state pretty flipping shaken up. For fun, it took about a half hour to let everyone in on the joke, it was a false alarm.

Let that wobble around for a sec – you’re on vacation with your kids and just gearing up for some beach time and all the phones around you scream to life, shouting holy f#ck, there’s a missile INBOUND right this minute. Oh umm seek shelter. WTF “seek shelter” means in the face of an immediate inbound missile attack is a different topic. But suffice it to say your vacation is gloriously unhinged. So you proceed to flip the hell out for the next 30 or so minutes until your phone says, JK JK, you’ve been punked. What the hell just happened?

So… the questions are:

  1. How did this happen and…
  2. How did it take so damned long to unf#ck.

The answer to both is, as a software developer, astonishing… and as someone with experience in government software (ahem healthcare.gov, looking at you), not the least bit surprising.

So it was human error that caused the alert to be sent out. Sort of. A human clicked the wrong button, yes, but WOW the interface that allowed that to happen is so far beyond amateur hour it’s not even funny.

Let’s have a look.

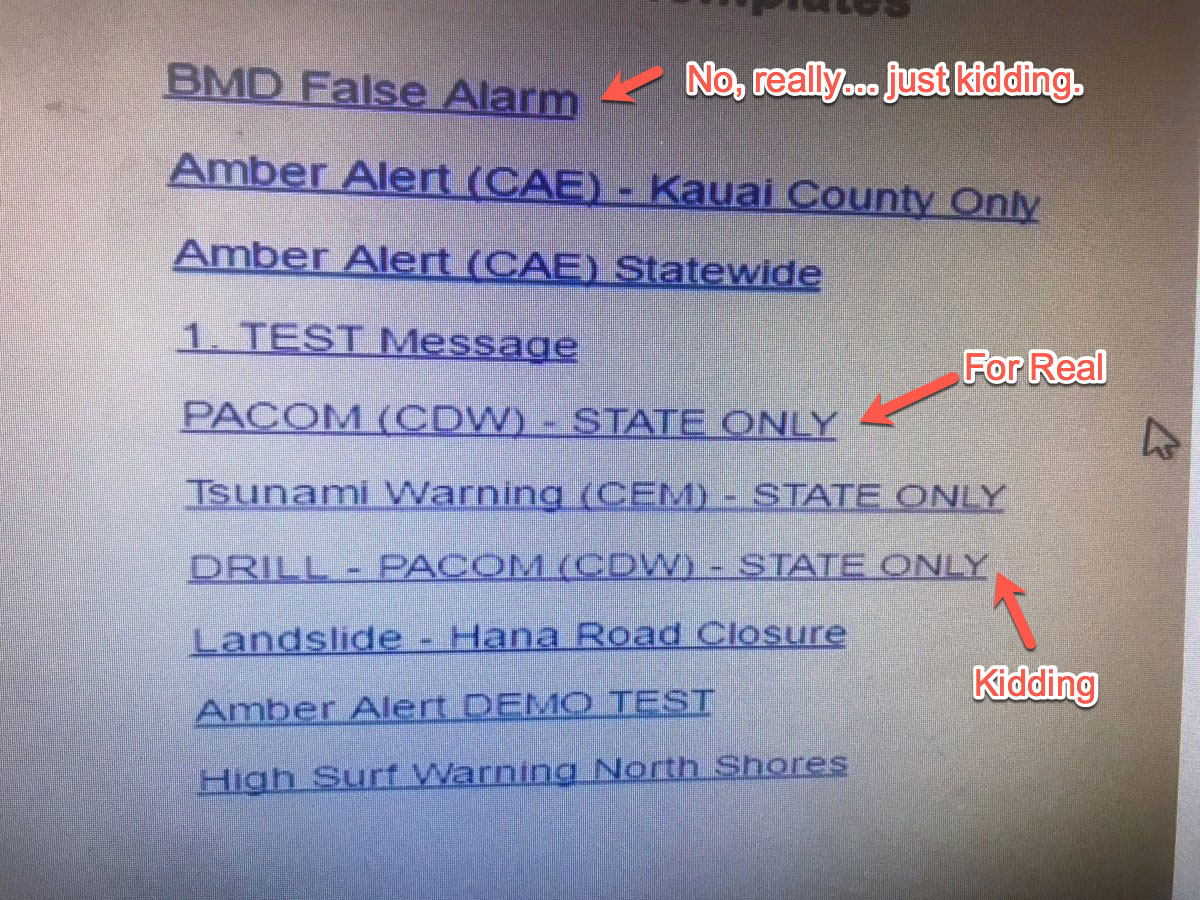
hawaii emergency alert system interface

Ok so here we see the interface in all it’s glory. Clicking one of those clearly and well designed links kicks off an emergency broadcast, presumably with no confirmation such as “Do you REALLY want to flip the entire state out right now?” The administrator clicked the “PACOM (CDW) – STATE ONLY” link instead of clicking the “DRILL – PACOM (CDW) – STATE ONLY” link. A simple mistake in the early morning that anyone could have made. And the best part was that even though he immediately realized what he’d done, there was NO way to undo or send a revised alert.

The problem here starts with UX and interface design.

  1. There is no visual distinction between drills, tests and the real deal.
  2. There is no failsafe or confirmation that forces a user to double check – “do you really want to send this?”. Seriously what software interface DOESN’T have a confirmation check for important actions? Confirm purchase, delete this image, cause statewide panic…
  3. There is was no undo. There was no way to send a revised alert or cancel the existing alert. The link at the top that says “BDM False Alarm” is new :). Brilliant.

This interface is pretty much unforgivable in the face of the magnitude of the system and that we’re in 2018 not 1992. Developers cannot create interfaces that allow this sort of simple mistake to happen. This was a software developers fault, plain and simple – not a human error or a training issue or any other political spin we want to throw at it. Design better software folks.

The Equifax Sh!tstorm & Those Pesky Security Updates

By Lithyem Insights

Importance of Software Security UpdatesJust to set the stage… Cyber theft is the fastest growing crime in the United States by far. Cyber crime damage costs are reported to hit $6 trillion annually by 2021. Global security and ransomware damage costs are on track to exceed $5 billion in 2017. That’s up 15x in just 2 years to $325 from 2015… and expected to get much worse. Cheers.

So now that you’ve got your head wrapped in tinfoil and bought a tiny house off the grid… what the hell happened?

This post isn’t about what to do if you were affected by the Equifax hack, there’s plenty out there on that. The interesting point here is one of the main causes of the hack in the first place was the failure to make timely security updates to critical software.

Read More

Why Excel is Threatening Your Business

By Lithyem Insights

Why Excel is Threatening Your Business

Forrester estimates that about 81% of all business use Excel. Excel is used for estimation, projection, day to day operations and pretty much anything you can imagine. Entire companies are run on Excel… it’s used in industries from finance to construction to education to medicine, relatively important stuff.

So… ?

Here’s a fun statistic: Researchers have found that up to 90% of all spreadsheets have errors that affect their results.

Let that sink in for a sec.

Read More

Your software project is going to fail

By Systems Thinking

Your software project is going to fail and I can tell you why.

I’ve been developing software solutions and involved in the technology space for nearly 20 years now. I’ve been responsible for designing and implementing some incredibly complex business platforms and I’ve seen over and over what works and what doesn’t. I’ve seen everything from huge successes to spectacular failures and just recently watched a huge belly flop of a platform rollout (I had nothing to do with it!) that got me thinking about how this keeps happening to so many companies trying to solve their technology challenges.

Read More

A System is NOT a Process

By Systems Thinking
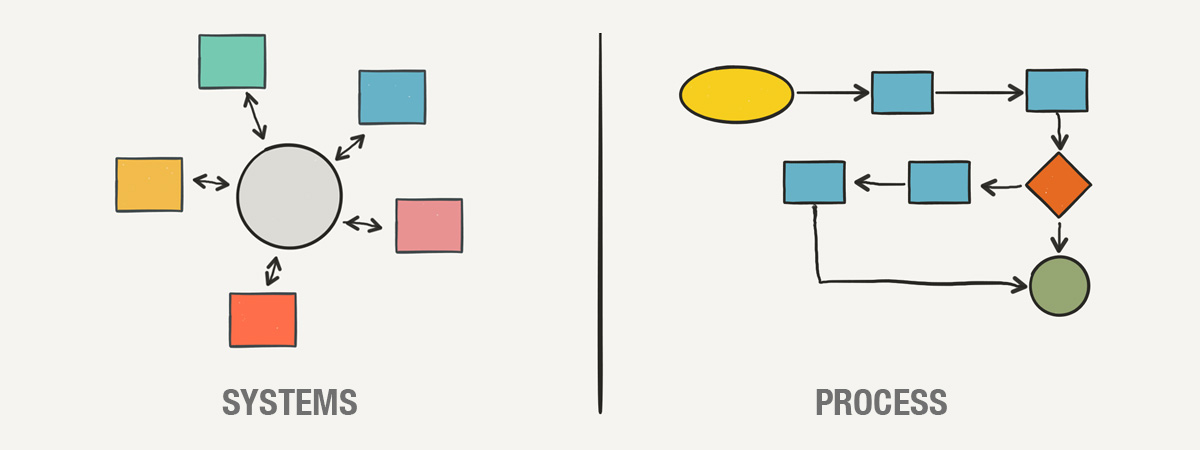
systems-process

I presented a workshop a few weeks ago for CONNECT called Bulletproof Information Systems and I noticed that what people struggled with most was understanding the distinction between a System and a Process. When asked to list a process they would like to map out, many people listed things like marketing and lead generation, both systems not processes.

A light bulb went on – they don’t know the difference, and neither do most people.

Read More